US Debt Situation, Investment and More
Recently, I have been harping on the vulnerability of the UK currency to a sharp decline or even collapse. But what about the US? Isn't the US vulnerable to some of the same issues facing the UK? Indeed this may very well be, although I think that there are two major differences. One is the the US holds the world's reserve currency and can therefore, pretty much write our own ticket. Secondly, the US does not have debt levels of the UK, although they may be fast approaching those of our English speaking cousins.
According the same source used for the estimate of 396% external debt/GDP the US ratio is only about 100%. Good news! Now, I believe that the total is higher, especially due to FRE/FNM bailouts, AIG bailout, Citi and BAC bailouts and such recent "financial innovations" which have undoubtably increased total indebtedness, albeit with much of it "off the balance sheet" and not accurately and forthrightly disclosed, thus the "Audit the Fed" movement, which I whole-heartedly support. Reasonalby, the debt/GDP ratio is probably 50-100% higher, but even at double the level, 200% would be relatively good compared to other Western financial economies, which have levels of debt more similar to Iceland than ours. For these reasons, I believe that it will be a few more years before we have to pay the piper. But when we do, it will be painful. The graph below may indicate why.

Not surprisingly, the net investment position of the US has been declining for twenty years. And it has really been accelerating for the last ten! We have almost $4T negative net equity. In other words, others own more of us than we do of them. So when the time comes to get paid, there will likely be some unhappy international creditors looking to collect from the US.
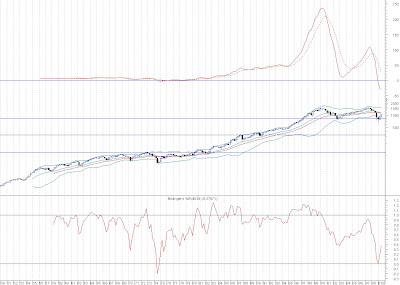
The SP 500 has had a run lately, but I wanted to look at the longer term picture for a moment.
The attached chart of the Quarterly SP500, shows the last 50 years. This shows a double bottom around the 700 level on the S&P, both this year and 2002. This has a similar pattern to the 74 bottom in the market. But are we in a similar position today? From the chart it would appear so, but considering the debt structure today in America, this may not be the case. In other words, we still had the borrowing capacity to leverage up some more and keep the system expanding back in the '70's. I am not so sure that we are in that position today. So it is no wonder why many are worried about inflation given the similarities with that decade, but history and the markets do not repeat so obviously. A more bearish possibility exists. That is one which views the current rally as just that: a rally in a bear market. And given the size of the boom the size of the bust may be accordingly large, resulting in a bottom on the S&P 500 around 300, or even as low as 100. More detailed analysis will be forthcoming in the weeks ahead, but to start the dialog here is a raw chart of the last 50 years of quarterly action in the S&P 500.
According the same source used for the estimate of 396% external debt/GDP the US ratio is only about 100%. Good news! Now, I believe that the total is higher, especially due to FRE/FNM bailouts, AIG bailout, Citi and BAC bailouts and such recent "financial innovations" which have undoubtably increased total indebtedness, albeit with much of it "off the balance sheet" and not accurately and forthrightly disclosed, thus the "Audit the Fed" movement, which I whole-heartedly support. Reasonalby, the debt/GDP ratio is probably 50-100% higher, but even at double the level, 200% would be relatively good compared to other Western financial economies, which have levels of debt more similar to Iceland than ours. For these reasons, I believe that it will be a few more years before we have to pay the piper. But when we do, it will be painful. The graph below may indicate why.

Not surprisingly, the net investment position of the US has been declining for twenty years. And it has really been accelerating for the last ten! We have almost $4T negative net equity. In other words, others own more of us than we do of them. So when the time comes to get paid, there will likely be some unhappy international creditors looking to collect from the US.
The SP 500 has had a run lately, but I wanted to look at the longer term picture for a moment.
The attached chart of the Quarterly SP500, shows the last 50 years. This shows a double bottom around the 700 level on the S&P, both this year and 2002. This has a similar pattern to the 74 bottom in the market. But are we in a similar position today? From the chart it would appear so, but considering the debt structure today in America, this may not be the case. In other words, we still had the borrowing capacity to leverage up some more and keep the system expanding back in the '70's. I am not so sure that we are in that position today. So it is no wonder why many are worried about inflation given the similarities with that decade, but history and the markets do not repeat so obviously. A more bearish possibility exists. That is one which views the current rally as just that: a rally in a bear market. And given the size of the boom the size of the bust may be accordingly large, resulting in a bottom on the S&P 500 around 300, or even as low as 100. More detailed analysis will be forthcoming in the weeks ahead, but to start the dialog here is a raw chart of the last 50 years of quarterly action in the S&P 500.

posted by Matt Butler at 10:07 PM
![]()
![]()


0 Comments:
Post a Comment
<< Home